
Dashboard tour
The dashboard at / is the one page you’ll actually look at. It’s
designed for the question “is the heat pump doing the right thing right
now?” — not for diagnostics.
The hero
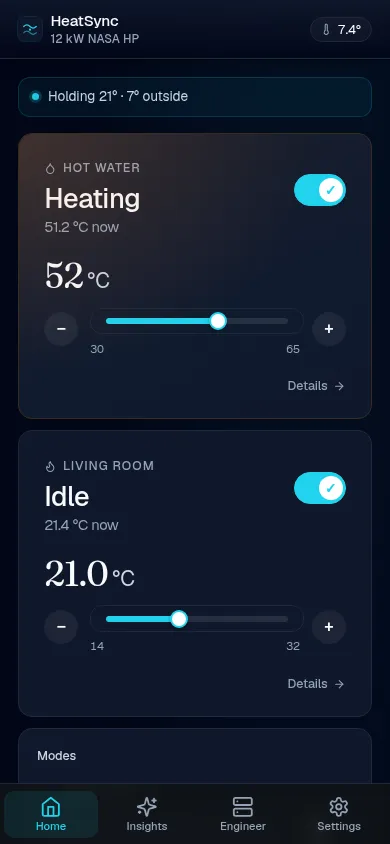
Section titled “The hero”Top of the page, two big numbers: room temperature (from the indoor unit’s own sensor or a BLE injection) and outdoor temperature. The hero is updated in place every 2 seconds so the number animates rather than flickering.
The colour bar around the room temp dial is the operating mode — heating (amber), cooling (blue), idle (grey).
Hot water tank card
Section titled “Hot water tank card”Three controls in one card:
- On/off toggle — flips DHW power immediately. Optimistic update so the visual doesn’t snap back during the 5 s round-trip.
- Mode picker — Eco / Standard / Power / Force, mirroring the wired remote’s DHW mode options.
- Target stepper —
−and+buttons step the target ±1 °C (range 30–65). Works whether DHW is on or off (target is independent of power state). - Schedule summary — a single-line description of the current
schedule e.g.
23:00–07:00 → 55°C · top-up <40 → 45°C. The cog (⚙) in the card title opens the full schedule editor in a modal.
Below the controls: the tank temperature stat and a sparkline showing tank temp + target overlay over the last ~30 minutes.
Heating water card
Section titled “Heating water card”- Mode picker — Off / Heat / Cool / Auto. Off uses
power=false; the other three sendpower=trueplus the relevant Mode enum. - Flow target, flow actual, return inlet — the heating-loop temps. A chip shows the live Δ between target and actual.
- Sparkline of flow_actual with flow_target overlaid.
Outdoor unit card
Section titled “Outdoor unit card”A compact view — outdoor temperature, compressor frequency, current
power draw (W), lifetime energy (kWh), and a “More diagnostics →” link
to /diagnostics for the full sensor dump (refrigerant temps, voltage,
current, EEV positions, IPM temp, etc.).
Lifetime efficiency card
Section titled “Lifetime efficiency card”Appears once both lifetime energy registers (heat generated, electric consumed) have broadcast — typically within 5 minutes of bus traffic starting.
Shows the lifetime SCOP: kWh of heat delivered ÷ kWh of electricity consumed. UK air-source heat pumps typically average 2.8–3.5 over a year. Colour cue: green ≥ 3.5, neutral 2.5–3.5, amber < 2.5.
Fault banner
Section titled “Fault banner”When any unit reports errorCode != 0, a red banner appears at the top
of the device list with the error code. The status LED switches to a
slow red breath. The same condition also publishes to a Fault
binary_sensor in Home Assistant.
Schedule strip
Section titled “Schedule strip”A thin strip below the hero shows the active hot-water schedule mode when one’s enabled — “Combo mode — heating between 01:00–02:00 (forecast peak 21 °C)” or similar. Click it to jump to the full hot-water page.
Bottom nav
Section titled “Bottom nav”The fixed bottom-nav has four destinations:
- Home — this dashboard.
- Insights — heat-loss analyser, daily energy/cost/carbon charts, cycle history.
- Engineer — diagnostics + bus sniffer + faults catalogue.
- Settings — the
/confighub: Device, Energy, Home Assistant, Data sources, Sensors, Maintenance (Firmware + Device info), Engineer tools (Live diagnostics, Bus sniffer, API reference, FSV reference).